Features
To compare different signals for our project, we gathered different features from our inputted sound files. These consisted of:
-
Average Value
-
Standard deviation
-
Minimum and Maximum Values
-
Range
-
Derivatives (up to nth order)
For any given signal, we gathered these features in the time domain, from the Fourier coefficients, Mel-Frequency Cepstral Coefficients (MFCCs), the pitch contour data, and from specific linguistic traits. Read on to learn about each of these features!
Time Domain
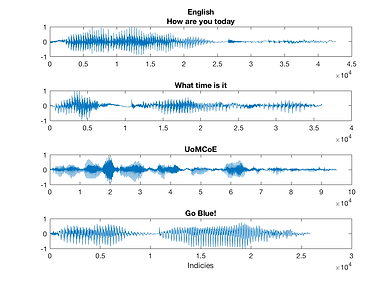
The most straight forward features are acquired from the normal, unaltered signals directly. These are the easiest to compute compared to other features. Below are plots of both English and Chinese samples without modification

Fourier Coefficients
By computing the discrete Fourier Transform for our signals, we transform our signals into the frequency domain and allows us to compute features based on the frequency of different signals. This is important as it allows us to gather frequency-based data of our signals that would otherwise be difficult to gather from time domain signals.
Mel-Frequency Cepstral Coefficients
Throughout our research, we found that the Mel-frequency Cepstral Coefficients (MFCCs) were especially effective in speech signal processing as they mimic the natural filtering done by a person's vocal tract. The MFCCs are a representation of the short term power spectrum of a signal, which breaks down how much energy is in a signal given any particular frequency. To compute the MFCCs, the signal is first framed and windowed for each frame. Then, the discrete Fourier transform is computed for each windowed frame and has the Mel Filterbank applied to create the power spectra. The log is taken of each component as sound is logarithmic, and finally the discrete cosine transformation is applied clean up the signals, as overlap between the signals occurs following the Mel Filterbank.

Pitch Contour
Finally, we also extracted the pitch contour of our speech samples. We used the program Praat, a widely used application to analyze speech, to extract the pitch contour data. Praat uses the autocorrelation technique to extract pitch data from an audio sample. The pitch contour lines are illustrated in blue in the spectrograms below.
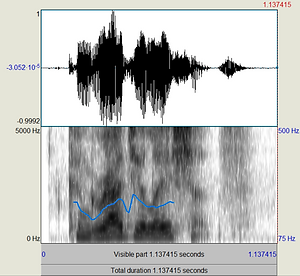

Qualitatively, we noticed that the pitch contour of the samples spoken in English (left) was usually more continuous and a flatter, while the samples spoken in Mandarin (right) had a pitch that was usually more fragmented and had steeper drops. In order to quantify these features, we extracted the raw pitch data from Praat and imported into Matlab. From here, we were able to find the mean, range, derivative, and duration of each segment of the pitch contour line.
Linguistic Analysis
From a linguistic perspective, one of the most defining features between the English and Chinese language is their respective phonetic system. The phonetic system used in English contains about 40 different phonemes, while the Chinese analog, known as the Bopomofo (or also 注音符号) system utilizes 37 different pronunciations in conjunction with 4 distinct tones. In order to draw a clear distinction between the two languages, we looked for phonemes that exist in one language and not the other that could be quantified in some way. Although we were not able to implement an analysis of each, here is a list of phonemes that are unique to the English language: {/v/,/z/,/ʃ/,/ʒ/,/ʧ/,/ʤ/,/θ/,/ð/}. We encourage you to check out the link below for more information on phonemes as well as a few words that exemplify each sound: https://www.teachingenglish.org.uk/article/phonemic-chart
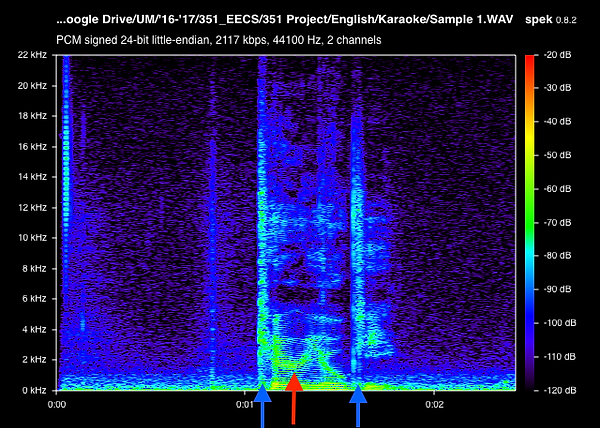
In addition to the phoneme list above, we found that a phoneme that exists in English known as the “retroflex R” does not exist in most Chinese dialects. The retroflex R sound is made using the blade of the tongue; however, most Chinese dialects will replace this sound with something called “dentals”, which is a sound made by the tongue being placed against the lower teeth. We attempted to incorporate the analysis of this feature into our project via a few different means. One way was by comparing the spectrogram of an English sample against the spectrogram of a Chinese sample and trying to construct an analysis of the fundamental frequencies that the retroflex R sound is composed of.
Below are two example spectrogram plots output from a program called Spek that helped support our hypothesis. The plot on the left is the spectrogram for the English word ‘karaoke,’ while the right-hand plot is the spectrogram of the same word spoken in Mandarin; however in Mandarin, ‘karaoke’ is phonetically translated to ‘ka-la-ou-kei.’ We believed that this case did a good job exemplifying the frequency of retroflex R sound (denoted by the red arrow) that would then allow us to observe a noticeable difference in both the Fourier coefficients around this frequency as well as the MFCCs in the respective frequency bin.
English Spectrogram
Chinese Spectrogram

Aside from the Fourier coefficients and MFCCS, we also attempted to implement Matlab’s ‘xcorr’ function with pure samples of the retroflex R phoneme in order to draw a correlation across all of our samples as another feature to be selected as useful or not.
Furthermore, Chinese is also a very rhythmic language in comparison with English, so we ran all of our samples through Matlab’s ‘envelope’ function in order to derive a relationship between the relative peaks in the sample and see whether or not we could observe this rhythmic nature.
